
Controlled Substance Loss: The Drugs Pharmacies Report Most Often
Published November 16, 2026
Lorazepam, codeine and methylphenidate lead six years of Health Canada pharmacy loss reports. What the list means, and how some pharmacies use it.
Health Canada has released six years of loss and theft reports filed by Canadian pharmacies: 100,068 reports from 2018 to 2023, from 9,559 anonymised pharmacy locations, under Access to Information release A-2025-000763. Each report lists the products involved by name. Read together, they show that a short list of drugs turns up again and again, and that almost every report, 97,596 of them, is a loss rather than a theft. This page sets out which drugs and products lead, what those counts can and cannot tell a pharmacy, and why some pharmacies use their own version of the list to decide which products to check between full counts. The full tables, by province and by year, are in NarcCount's data report on narcotic losses and thefts. This is general information drawn from public data, not advice on what a pharmacy is required to do.
The drugs named most often, 2018 to 2023
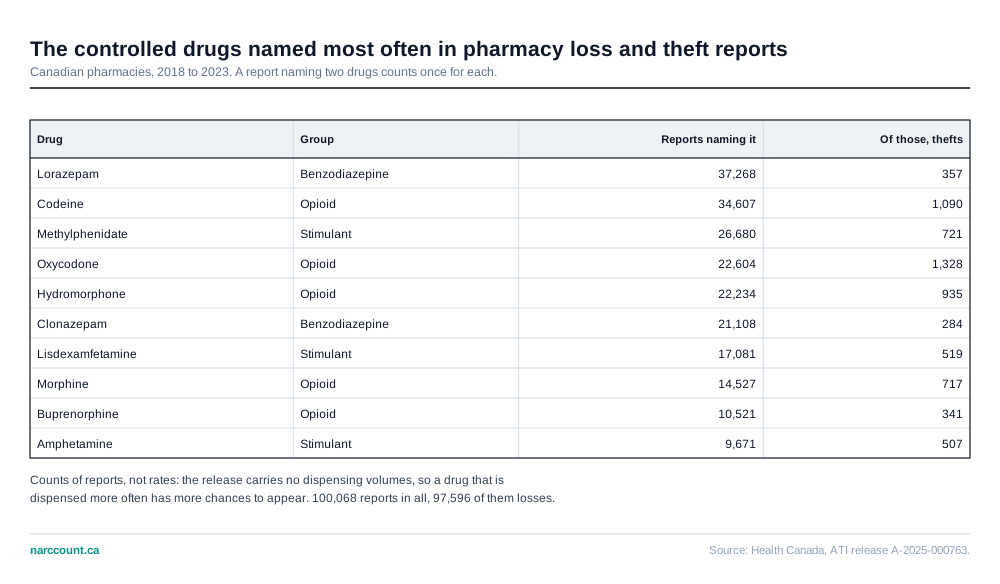
Lorazepam is named in more pharmacy loss and theft reports than any other drug: 37,268 of them. Codeine follows with 34,607, then methylphenidate with 26,680, oxycodone with 22,604 and hydromorphone with 22,234. Clonazepam (21,108) and lisdexamfetamine (17,081) complete the leading group. Three of the top seven are not opioids at all, which matters for any pharmacy that thinks of loss reporting as an opioid problem: benzodiazepines appear in 56,136 reports and the ADHD stimulants in 41,452. A report that names two drugs is counted once for each, so the rows add up to more than the report total.
The products behind those numbers
The release names products, not just ingredients, and the same few products account for much of each drug's total. Product spellings vary from report to report, so the counts below are reports naming any spelling of the product. Sublingual lorazepam tablets appear in 19,078 reports, just over half of all lorazepam reports. Lenoltec No. 3 from any maker appears in 15,901, of which Teva-Lenoltec No. 3 accounts for 11,840. Vyvanse appears in 17,081, Concerta in 14,101 and Teva-Oxycocet in 11,091. Each is a product a community pharmacy handles constantly, and the next section explains why that, more than anything about the product, puts it near the top.
What the list does not say
These are counts of reports, not rates. The release carries no dispensing volumes, so it cannot show how many tablets were handled for every one reported missing. A product that moves through a pharmacy every day is received, filled, counted and returned to the shelf far more often than a slow mover, and each of those steps is a chance for a small miscount. A high place on the list reflects how common a product is; it says nothing about the quality of the product or its packaging. The list also cannot say why anything went missing: the 2018 to 2023 release records only whether a report was a loss or a theft.
Most losses are small and never explained
The typical loss is a handful of tablets. In the 2018 to 2023 release, the median loss report covered 11 tablets or capsules, against 922 for the median theft. The newer opioid releases, covering September 2024 to February 2026, also record the type of incident. Of 17,653 pharmacy reports in them, 16,807, or 95%, were filed as an unexplained loss. The median was 5 units, about a quarter of losses were a single unit, and about half were 5 units or fewer. A shortfall that small is easy to explain on the day it happens and hard to trace weeks later, once hundreds of fills, receipts and returns sit between the last count that balanced and the one that did not.
Counting the most-lost products between full counts
Some pharmacies respond by keeping a short list of the products behind most of their own discrepancies, and counting those more often than the rest of the shelf, in between the full counts they already do. The reasoning is about the search, not the count. When a product is checked more often, a shortfall is found while the gap since the last good count is short: fewer transactions to go back through, and the person who filled the prescription or received the order still remembers it. A spot check adds to whatever count schedule the pharmacy follows under its province's rules; it does not replace it.
- Start from your own discrepancy history, not the national table. Losses are uneven between pharmacies: the 10% of locations that filed the most accounted for 43% of the reports, while the median reporting location filed 4 in six years.
- Keep the list short, a handful of products, so the extra checks stay quick enough to keep doing.
- Record each spot check the same way as any count: the date, the quantity found, the expected quantity and who counted.
- Revisit the list when your own pattern changes, for example after a new supplier, a new strength or a change in which products move fastest.
Where NarcCount fits
NarcCount keeps an expected on-hand quantity for every drug line from the purchase, dispensing and destruction records a pharmacy uploads, and flags and ranks the variances at each count. Over a few months, that ranking is the pharmacy's own version of the table above: the products that keep coming back are the ones worth a closer look.
Sources
Show the 5 sourcesHide the sources
- Health Canada, Access to Information release A-2025-000763: controlled drug loss and theft reports from pharmacies in Canada, 2018-2023 — 100,068 reports from 9,559 anonymised pharmacy locations. One line per drug in each report, with the product name, quantity and province. No incident sub-type and no dispensing volumes.
- Health Canada, Access to Information release A-2025-000651: opioid loss and theft reports, September 2024 to August 2025 — Opioids only, every reporter type; this page uses the pharmacy reports.
- Health Canada, Access to Information release A-2025-001467: opioid loss and theft reports, August 2025 to February 2026 — Opioids only, with the incident sub-type (for example, unexplained loss or forged prescription).
- Health Canada, Types of incidents: loss or theft of controlled substances and precursors — The loss and theft categories a report is filed under.
- NarcCount, Narcotic losses and thefts in Canadian pharmacies (the full data report) — National and provincial tables built from the three releases above, with a CSV.
Primary sources for the figures on this page. Regulations change; confirm the current requirement with the source before you rely on it.
More resources
NarcCount does the reconciliation math for you and flags every variance. Get started or read the worked reconciliation example.
General information, not legal or professional advice. For authoritative requirements, refer to the Ontario College of Pharmacists and Health Canada.